Lesson 01: Flowcharts
Program development can be described as a serval step process:
- Understand the problem.
- Plan the logic of the program.
- Code the program using a structured computer language.
- Using a compiler, translate the source code into a machine-executable program.
- Test and debug the program.
- Put the program into production, write the manual, and prepare some training plans for customers.
- Maintain and enhance the program.
Planning the logic of the program requires the development of algorithms. An algorithm is a finite, ordered set of unambiguous steps that terminate with a solution to the problem. Human readable representations such as flowcharts and pseudocode are typically used to describe an algorithm's steps and the relationships among the steps.
A flowchart is a graphical representation of the steps and control structures used in an algorithm. A flowchart does not involve a particular programming language but rather uses geometric symbols and flowlines to describe the algorithm. From a flowchart, a programmer can produce the code required to compile an executable program.
Flowcharts can be an effective way to show steps in a process. But they can also be confusing and even misleading if not prepared properly.
When designing and creating a flowchart, keep in mind that the diagram needs to be easy to understand. Here are some tips for good flowchart design. Applying them will allow you to make flowcharts that are easier to read, understand, and use.
- Flowcharts must use standard notation for ease of reading and analysis.
- The text in each process should be concise, clear, and easy to understand.
- The drawing direction should be from top to bottom and from left to right.
- Flowlines should be avoided to be too long or crossed, and connector symbols can be used more frequently.
Online Flowchart: https://app.diagrams.net/
1.1 Basic Flowchart Blocks
What is a flowchart?
- A flowchart is a picture (graphical representation) of the problem-solving process.
- A flowchart gives a step-by-step procedure for the solution of a problem.
Uses of a flowchart
- To specify the method of solving a problem.
- To plan the sequence of a computer program.
- Communicate ideas and solutions.
- Show the logic of the classification of data.
- To teach and also to learn.
Features of Flowchart
A flowchart represents a dynamic process, usually with a "starting point" and one "endpoint". A block diagram is a type of flowchart. Flowcharts can intuitively and clearly represent all the steps of a dynamic process from start to finish. It is a diagram composed of graphic symbols and text descriptions.
Flowchart symbols and their purpose
| Geometric Shape | Symbol Name | Purpose |
|---|---|---|
 |
Flowlines | Arrows are used to connect the steps in a flowchart to show the flow or sequence of the problem-solving process |
 |
Terminal | An ellipse (or lozenge) is used to indicate the start and end of a flowchart. The Start is written in the ellipse indicating the beginning of a flowchart. End, Stop, or Exit are written in the ellipse indicating the end of the flowchart. |
 |
Input/Output | A parallelogram is used to read data (input) or to print data (output). |
 |
Process | A rectangle is used to show the processing that takes place in the flowchart. |
 |
Decision | A diamond with two branches is used to show the decision-making step in a flowchart. A question is specified in the diamond. The next step in the sequence is based on the answer to the question, which is 「Yes」 or 「No」. |
 |
Subroutine | The predefined Process symbol shows the named process that is defined elsewhere. |
 |
On-page Connector | Pairs of the on-page connector are used to replace long lines on a flowchart page. |
 |
Off-page Connector | An off-page connector is used when the target is on another page. |
Flowlines
Terminal
Input/Output
Process
Decision
Decision
A decision or branching point. Lines representing different decisions emerge from different points of the diamond.
Decision symbols are represented by diamonds. The label in a decision block should be a question that clearly has only two possible answers. The decision block will have exactly one input and two outputs. The two outputs will be labeled with the two answers to the question to show the logic flow direction depending upon the decision made.
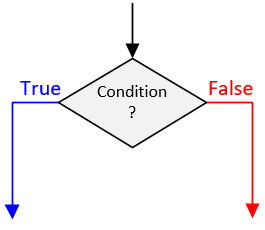
Subroutine
Subroutine
Indicates a sequence of actions that perform a specific task embedded within a larger process. This sequence of actions could be described in more detail on a separate flowchart.
Subroutines are portions of code that run and return the execution point to the calling function. This allows you to write one subroutine and call it as often as you like from anywhere in the code. Subroutines make the code smaller and easier to test.
Connectors
The flowchart connector symbols are used to make a logic transfer to another location in the flowchart. A transfer location can be on the same page or another page. When you reach the bottom of the page or need to jump to another page, draw a flow chart connector symbol and connect it to the last item on the chart.
The connectors are used in pairs: in the originating drawing and the connected drawing. A flowline leaving a drawing requires a To connector. The same line in the second drawing requires a From connector. Both To and From connectors are represented by the same symbol, and both have the same connector number to identify the continuity.
On-Page Connector
Connects two or more parts of a flowchart, which are on the same page.
On-page symbol: a circle with a number or letter to identify the matching transfer location. The on-page connector shows a jump from one point in the process flow to another. They are handy for avoiding flow lines that cross other shapes and flow lines. They are also handy for jumping to and from a sub-process defined in a separate area from the main flowchart.
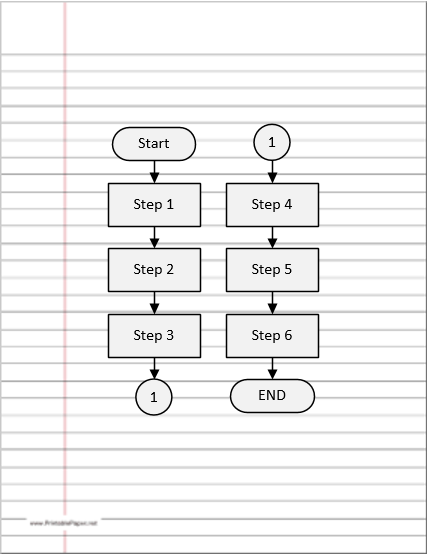
Figure 1.7: Sample Page Connector Example
Off-Page Connector
Connects two parts of a flowchart that are spread over different pages.
Off-page symbol: a square with a pointed bottom, containing a page number and a letter to identify the matching transfer location. The off-page connector shows the continuation of a process flowchart onto another page. The target page number must be added in the To symbol, and both To and From symbols have the same node letters (or numbers).
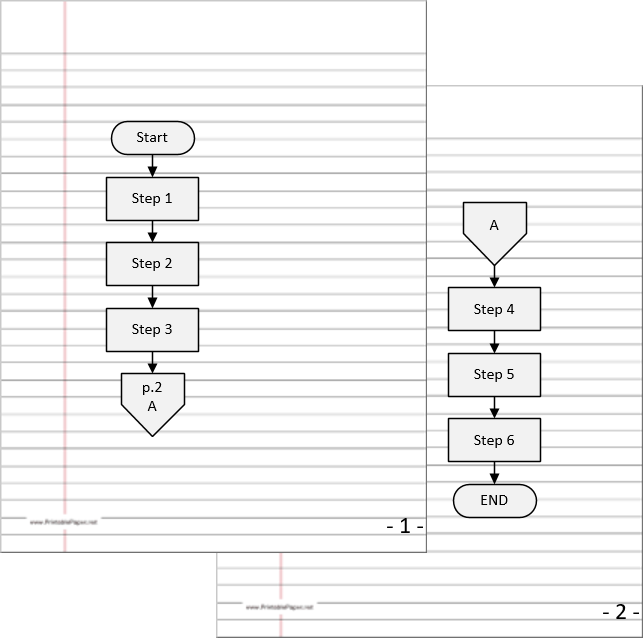
Figure 1.8: Off-Page Connector Example
Summary
- The flowchart can have only one start and one end symbol.
- On-page connectors are referenced using numbers.
- Off-page connectors are referenced using the alphabet.
- The general flow of processes is top to bottom or left to right.
- Arrows should not cross each other.
Further Reading
1.2 Flowchart Structures
Basic Structures
A structured flowchart is one in which all processes and decisions must fit into one of a few basic structured elements. The basic elements of a structured flowchart are shown below sessions. It should be possible to take any structured flowchart and enclose all of the blocks within one of the following process structures. Note that each of the structures shown below has exactly one input and one output. Thus the structure itself can be represented by a single process block.
Sequence Structure
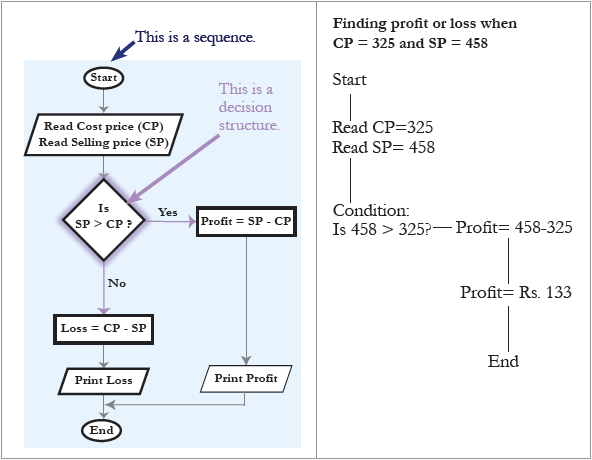
The sequence structure is just a series of processes carried out one after the other. Most programs are represented at the highest level by a sequence, possibly with a loop from the end to the beginning.
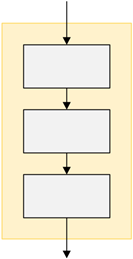
Figure 2.1: Sequence Structure
In sequence structure, each block performs an action or task and then connects to the next action in order. So, an action or event leads to the next ordered action in a predetermined order. A sequence can contain any number of tasks, but there is no chance to branch off and skip any tasks or actions. Once you start a series of actions in a sequence, you must continue step-by-step to execute each action until the sequence ends. When run, the program must perform each action in order with no possibility of skipping an action or branching off to another action.
Selection Structure
The selection structure is also known as an if-else structure and a decision structure. A selection structure is a programming feature that performs different processes based on whether a boolean condition is true or false. No matter which path to follow, continue with the next procedure.
There are two types of selection structures that can be used to achieve different outcomes.
if-else structure
The if-else structure is a two-alternative decision — actions are taken on both the true and the false sides.
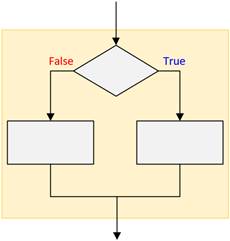
Figure 2.2.1: Selection Structure (if-else structure)
if structure
Sometimes, you may only want to perform an action or set of actions if a condition is true but do nothing special if it is false. This could be a flowchart as follows:
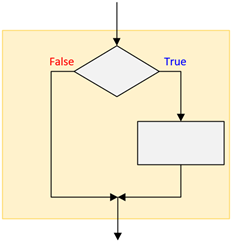
Figure 2.2.2: Selection Structure (if structure)
Case Structure
The case structure represents a series of if-else structures that compare the same variable with different expression values.
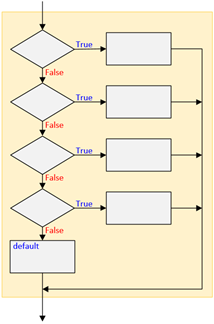
Figure 2.2.3: Nested if-else Structure
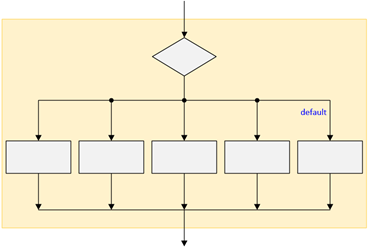
Figure 2.2.4: Case Structure
Loop Structures
The loop structures, also called repetition or iteration, repeat a set of actions based on the answer. In other words, it can repeat the same actions over and over again until the condition is false.
There are two types of loop structure:
While-Loop Structure
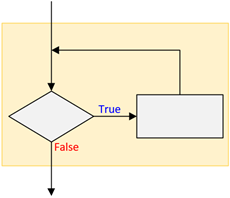
Figure 2.3: While Loop Structure
Do-While Loop Structure
The Do-While Loop structure differs from the White-Loop structure in that the action within the loop is always executed at least one time. This is equivalent to performing the actions once before going into a While-Loop. In the While-Loop structure, the actions may never be executed. Although the While-Loop structure is preferred, the Do-While Loop structure is sometimes more intuitive.
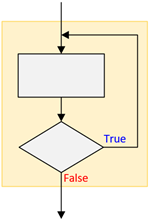
Figure 2.4: Do-While Loop Structure
Summary
- There are only three basic structures — sequence, selection, and loop structures.
- Each structure has one entry and one exit point.
- Structures attach to others only at entry or exit points.
1.3 Structured Program Design
Simple programming exercises can often be solved by just sitting down and writing code to implement the desired problem. Complex problems, however, can be difficult to write and impossible to debug if not implemented using a structured design process. Using a structured design process leads to the following benefits:
- Early detection of design flaws
- Programs that can be easily modified
- Clear and complete documentation
- Modular design to improve testing
- Modular design to break up a problem into smaller sections
The structured program mainly consists of three types of elements:
- Selection Statements
- Sequence Statements
- Iteration Statements
The structured program consists of well-structured and separated modules. The entry and exit in a Structured program is a single-time event. It means that the program uses single-entry and single-exit elements. Therefore a structured program is a well-maintained, neat, and clean program. This is the reason why the Structured Programming Approach is well-accepted in the programming world.
All logic problems can be solved using only these three structures — sequence, selection, and loop structures. A structured program includes only combinations of the three structures. All the structures can be combined in infinite ways and can be stacked or connected only at their entrance or exit points.
A structured program:
- Another structure can replace any individual action or step in a structure.
- Nesting: placing one structure within another
- Block: a group of structures that execute as a single unit
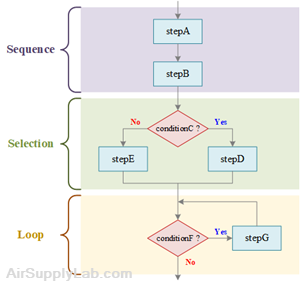
do stepA
do stepB
if conditionC is true then
do stepD
else
do stepE
endif
while conditionF is true
do stepG
endwhile
Figure 3.1: Structured Flowchart and Pseudocode
Flowchart Showing a Sequence Nested within a Selection
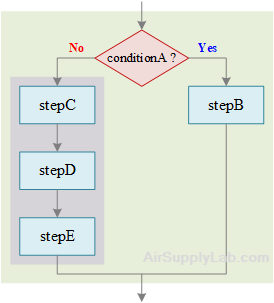
if conditionA is true then
do stepB
else
do stepC
do stepD
do stepE
endif
Selection in a Sequence within a Selection
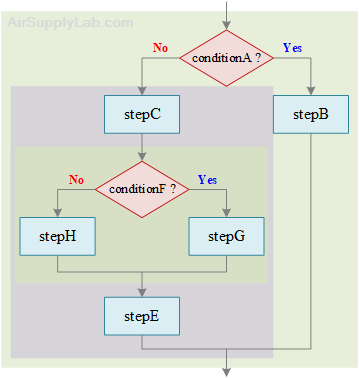
if conditionA is true then
do stepB
else
do stepC
if conditionF is true then
do stepG
else
do stepH
endif
do stepE
endif
Flowchart for For Loop within Selection within Sequence within Selection
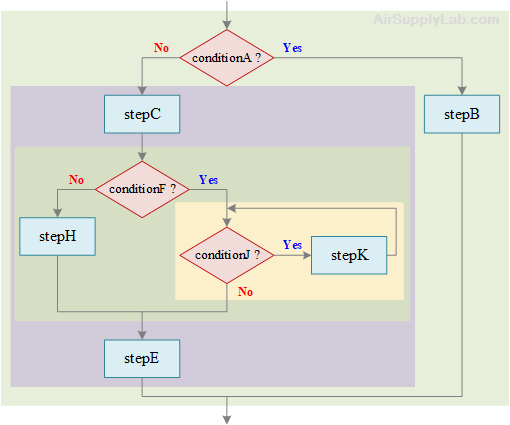
if conditionA is true then
do stepB
else
do stepC
if conditionF is true then
while conditionJ is true
do stepK
endwhile
else
do stepH
endif
do stepE
endif
1.4 Unstructured Program
Examples of Good and Bed Structured Programs
The following figure shows an example of a properly and improperly structured flowchart. The unstructured flowchart is an example of what can happen if a program is written first, and then a flowchart is created to represent the program. This type of unstructured flow is often called 'spaghetti' programming and normally has elements of its structure impossibly intertwined around other elements. A program of this sort is complicated to understand, implement, debug, and maintain.
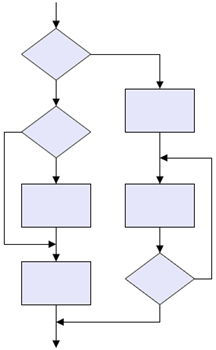
Figure 4.1: Structured Flowchart Example
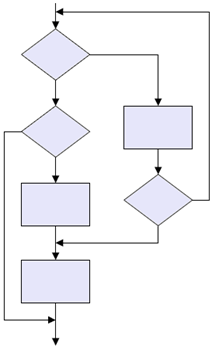
Figure 4.2: Unstructured Flowchart Example
Flowchart of Number-Double Problem
You are designing a program to ask users to put an integer number. If the number input is 0, then stop the program; otherwise, calculate the doubling value and display it on the screen. Then repeat the procedures again.
According to the question, you may draw the flowchart as below. Then, you have to think: Is this flowchart structured?
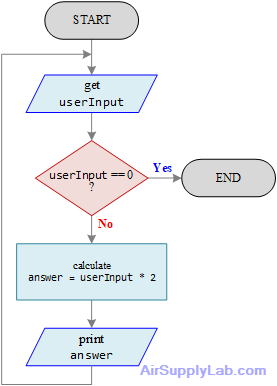
Figure 4.3: Unstructured Flowchart of a Number-Doubling Problem
The flowchart in Figure 4.3 may not be easy to tell it is structured or not. Reorganize the flowchart as below, then you will find that the flowchart does not look exactly like any basic structured flowcharts discussed in 1.2 Followchart Structures.
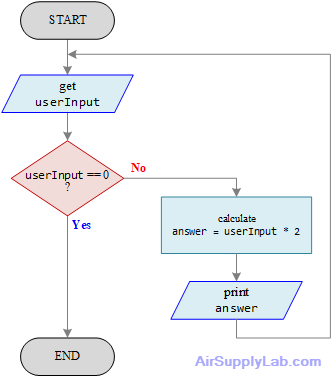
Figure 4.4: Functional but Nonstructured Flowchart
For the loop in Figure 4.4 to be a structured loop, the logic must return to the decision when the sequence ends. The flowchart in Figure 4.5 shows the flow of logic returning to the decision immediately after the sequence. Now the flowchart is structured.
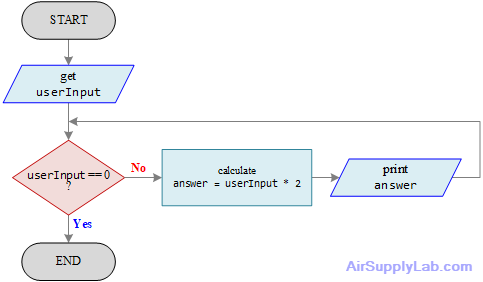
Figure 4.5: Structured, But Nonfunctional, Flowchart of Number-Doubling Problem
Let us follow the flowchart in Figure 4.5 to run the program. Assuming when the program starts, the user enters 10 for the value of userInput. Ten is not equal to zero, so the number is doubled, and 20 is printed out on the screen. Then the question userInput equal to zero is asked again. It can not be false, because the logic did not go to the get userInput block, the value of userInput never changed. Therefore, 10 is doubled again, and the answer 20 prints again. This goes on forever, with the 20 being printed repeatedly. The program logic shown in the above diagram is structured, but it does not work.
How can the number-doubling problem be structured and still work? Sometimes, some extra steps may be added to the flowchart to make the program to be structured. In this case, after printing the answer on the screen and before checking the userInput value, the get userInput step must be added in between in order to update the userInput value.
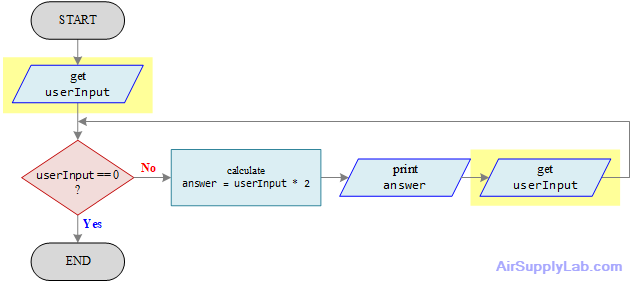
start
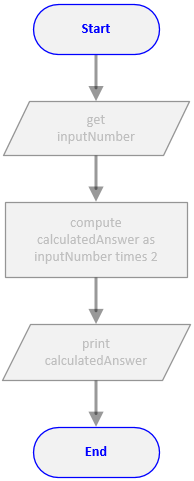
get userInput
while userInput is not equal to zero
calculate answer = userInput * 2
print answer
get userInput
endwhile
end
Figure 4.6: Functional, Structured Flowchart for the Number-Doubling Problem
Unstructured Selection
You are designing a system to determine discounts for customers based on their age. If they are younger than 10 or older than 55, they can get a 15% discount, otherwise, they can get a 10% discount.
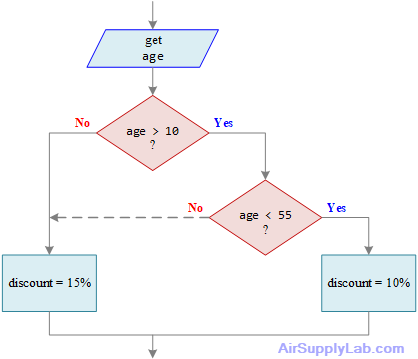
Figure 4.7: Unstructured Selection
Is the flowchart segment in Figure 4.7 structured?
No, it is not constructed from the three basic structures. There are two flowlines pointing to the same processing block (discount = 15%) from different selection structures, that must be untangled.
Follow the line on the left side of the Question (age < 55), just untangle it by repeating the step that is tangled. The result is the flowchart shown in Figure 4.8. The entire flowchart is structured — it has a sequence followed by a selection inside a selection.
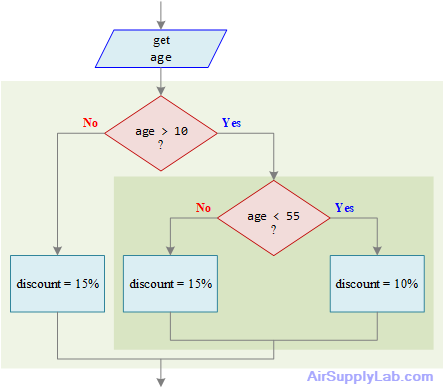
get age
if age is greater than 10 then
if age is less than 55 then
discount = 0.1
else
discount = 0.15
endif
else
discount = 0.15
endif
Figure 4.8: Finished Flowchart
Unstructured Loop
The flowchart in Figure 4.9 is neither a while loop (that begins with a decision and, after an action, returns to the decision), nor a do-while loop (that begins with an action and ends with a decision that might repeat the action). Instead, it begins like a while loop, with a process followed by a decision, but one branch of the decision does not repeat the initial process; instead, it performs an additional new action before repeating the initial process.
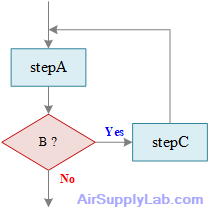
Figure 4.9: Unstructured Loop
Figure 4.10 shows the same logic as Figure 4.9, but now it is structured logic, with a sequence of two actions occurring within the loop. Does this diagram look familiar to you? It uses the same technique of repeating a needed step as in [Flowchart of Number-Double Problem]
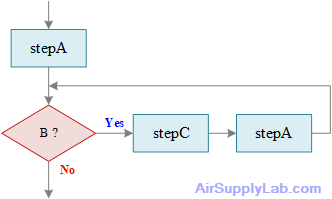
Figure 4.10: Sequence and Structured Loop That Accomplishes the Same Tasks as Figure 4.9
1.5 Flowchart on the Design of Algorithms
Basically, the design of an algorithm must satisfy the following criteria:
- Input data: clearly indicate what data to input in the program and how to input it.
- Output result: At least one output result is output.
- Clarity: The procedure described must be clearly feasible.
- Finiteness: The work must be done within a limited number of steps.
- Validity: Each step can be expressed with valid instructions.
Generally speaking, the algorithm of any problem is nothing more than three steps: (1) input data, (2) process data, (3) output results.
Steps to Design a Flowchart Diagram
- The first step is to express the algorithm steps in natural language;
- The second step is to determine the logical structure contained in each algorithm step, and represent it with the corresponding block diagram to obtain the block diagram of the step;
- The third step is to connect the block diagrams of all the steps with flow lines and add terminal boxes to obtain a block diagram representing the entire algorithm.
Flowchart Examples
Find Largest of Three Given Numbers
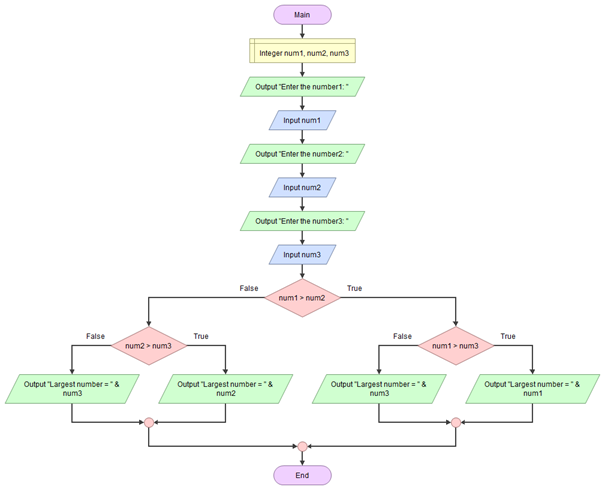
Ask user to input three integers and find the largest number among them. Given three numbers num1, num2, and num3. The task is to find the largest number among the three.
Enter the number1 = 12
Enter the number2 = 62
Enter the number3 = 27
Largest number = 62
Algorithm
to find the greatest number of three given numbers:
- Ask the user to enter three integer values.
- Read the three integer values in num1, num2, and num3 (integer variables).
- Check if num1 is greater than num2.
- If true, then check if num1 is greater than num3.
- If true, then print 'num1' as the greatest number.
- If false, then print 'num3' as the greatest number.
- If false, then check if num2 is greater than num3.
- If true, then print 'num2' as the greatest number.
- If false, then print 'num3' as the greatest number.
Leap year
A common year has 365 days and a leap year has 366 days, the extra day is the 29th of February.
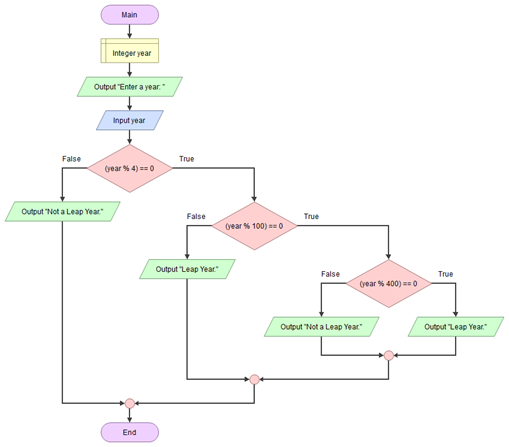
Leap Year Algorithm 1
Leap Year Algorithm 1
The algorithm to determine if a year is a leap year is as follows:
- Leap years are any year that can be exactly divided by 4.
- Except if it can be exactly divided by 100, then it is not leap year.
- Except if it can be exactly divided by 400, then it is a leap year.
Design a flowchart diagram that takes in a year and determines whether that year is a leap year.
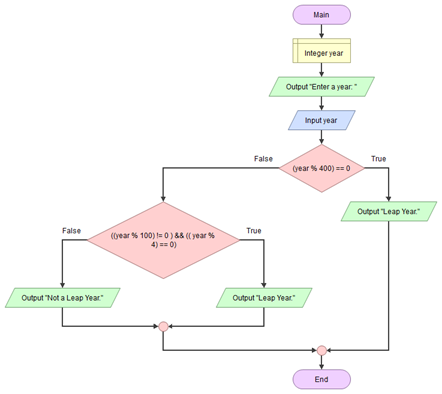
Leap Year Algorithm 2
Leap Year Algorithm 2
The algorithm to determine if a year is a leap year is as follows:
- A year is called a leap year if it is divisible by 400.
- If a year is not divisible by 400 as well as 100, but it is divisible by 4 then that year is also a leap year.
Design a flowchart diagram that takes in a year and determines whether that year is a leap year.
Question:
- Use the flowchart to check if the following year is a leap year or not.
- 2000
- 2004
- 2101
- 2100
- 1986
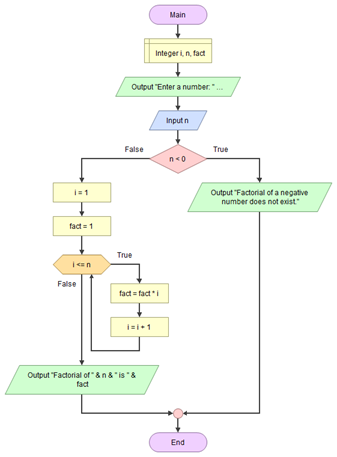
Find Factorial of Number
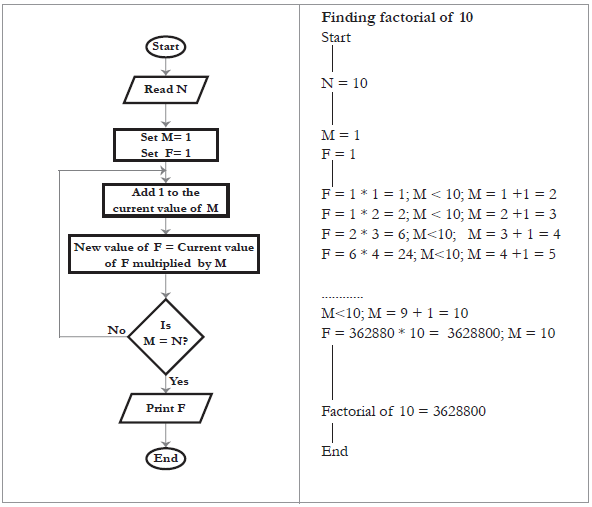
Factorial is used in many mathematics areas but mainly in permutation and combination. Factorial is the product of all positive numbers from 1 to n (user-entered number). Simply, we can say that the factorial of n would be $1 \times 2 \times 3 \times \cdots \times n$.
Note: No factorial existence exists for the negative number, and the value of 0! is 1.
Algorithm
The factorial of a positive number would be:
$n! = 1 \times 2 \times 3 \times \cdots \times n$
For example:
$5! = 5 \times 4 \times 3 \times 2 \times 1 = 120$
| n | n! |
|---|---|
| 0 | 1 |
| 1 | 1 |
| 2 | 2 |
| 3 | 6 |
| 4 | 24 |
| 5 | 120 |
| 6 | 720 |
| 7 | 5040 |
| 8 | 40320 |
| 9 | 362880 |
| 10 | 3628800 |
Homework
Q01 Draw Flowcharts
Use an online flowchart website to draw the following flowcharts, export them as a PDF file then submit them before the due. (Do not hand draw any flowcharts.)
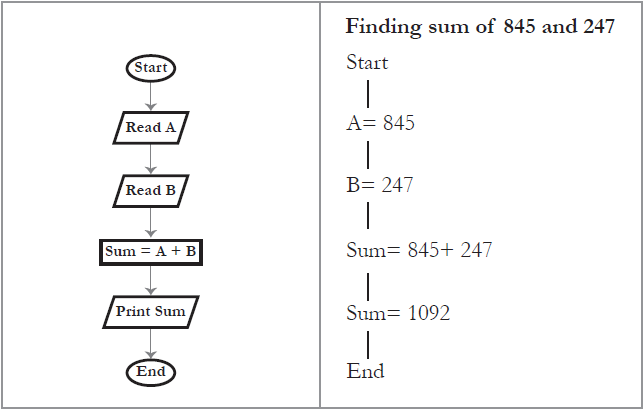
* Draw the flowchart on the left, including comments and arrows.
Q02:Match the elements of a flowchart
Match the elements of a flowchart and their purpose of use in the following:
The elements include: [Loop], [Start], [Process], Input], [Stop], [Decision], and [Output]
| Purpose | Use |
|---|---|
| Calculate the total of A, B, and C. | |
| Indicate that the problem has been solved. | |
| Find if a number is greater than the other. | |
| Read a number and calculate the factorial of the number. | |
| Read three numbers. | |
| Print the total. | |
| Indicate the beginning of a problem-solving flow. |
Q03: Puzzle
Complete the crossword puzzle.
| 1 | |||||||||
| 2 | |||||||||
| 3 | |||||||||
| 4 | |||||||||
| 5 | |||||||||
Across
- I am a rectangle in a flowchart. What do I represent?
- When you want to show a decision-making step, you can use this box.
- You can use me to communicate ideas; and graphically represent a problem-solving process.
- I connect two geometrical boxes in a flowchart.
Down
- In the flowchart, I represent data or information that is available.
- All flowcharts begin with me. I am elliptical in shape.
Q04: Programming Structure
For each of the unstructured flowcharts as below, redrawn in such a way that the logic remains the same but is structured. Also, highlight the different types of structures. Do not hand draw any flowcharts.
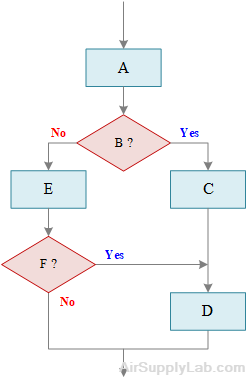
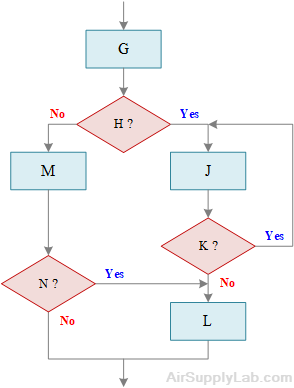
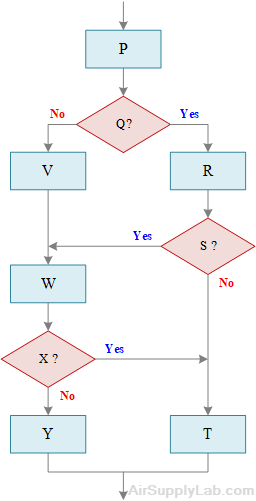
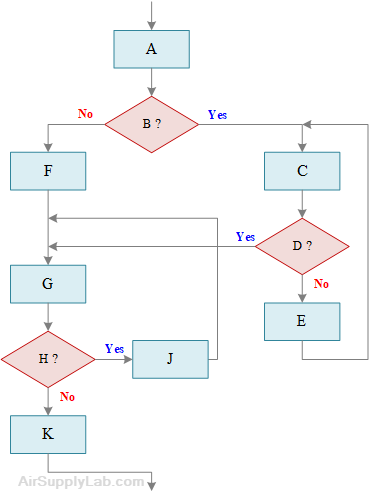

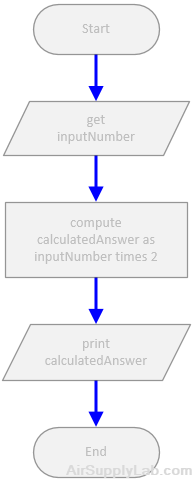
 or
or 
